
November was “Peace Month” at the Academy and every class worked on a peace-related project. Alex and Arnold’s Grade 9 math classes learned about one way of quantitatively measuring peace : the Global Peace Index (GPI) published by the Institute for Economics and Peace. Students reflected on the validity of such a measure. They then used their data management skills to investigate how different factors are correlated with GPI.
The Grade 9s collected data using the GPI Score Map, as well as using their research skills to find data sets related to factors of their interest. They then used scatter plots and lines of best fit in google sheets to analyze correlation between the factors of their choosing and GPI.
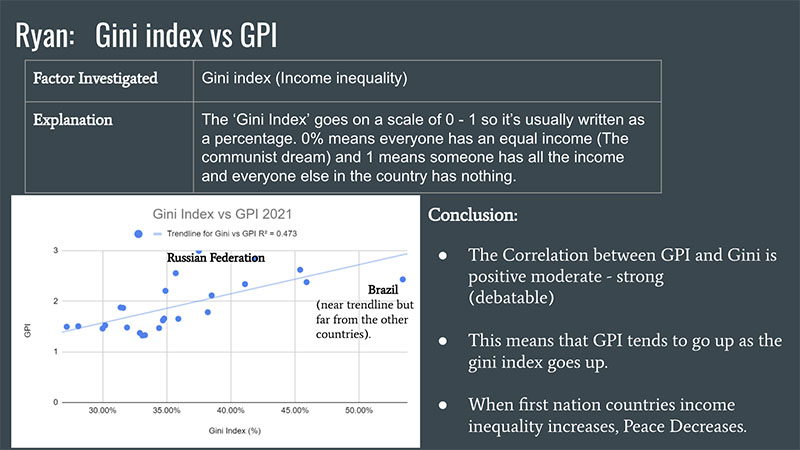
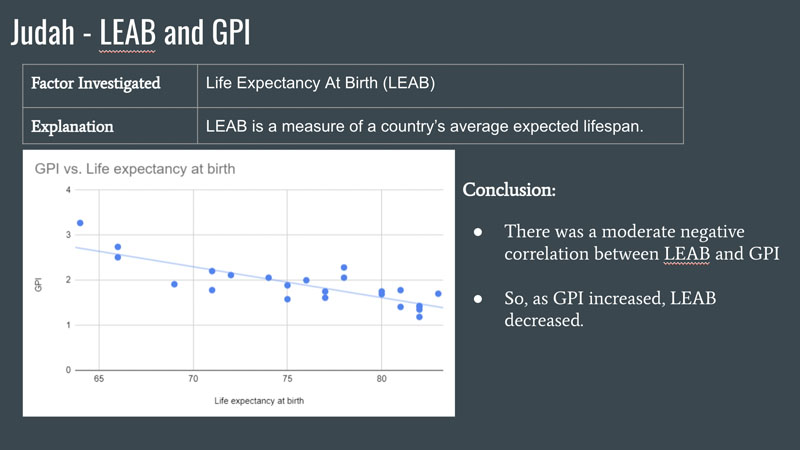
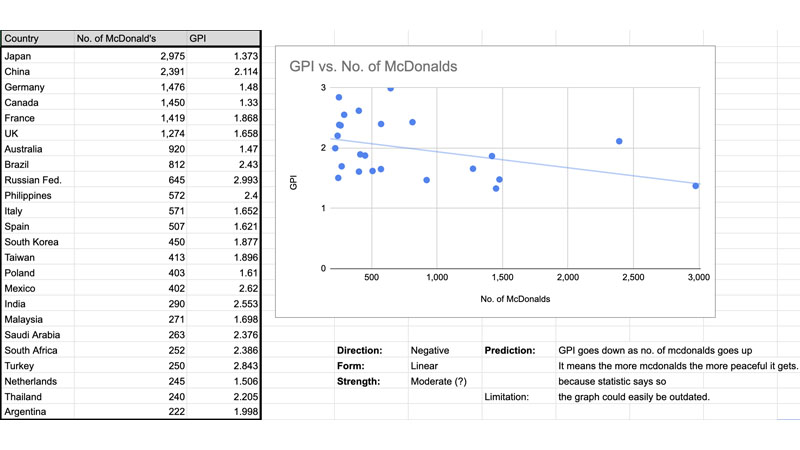
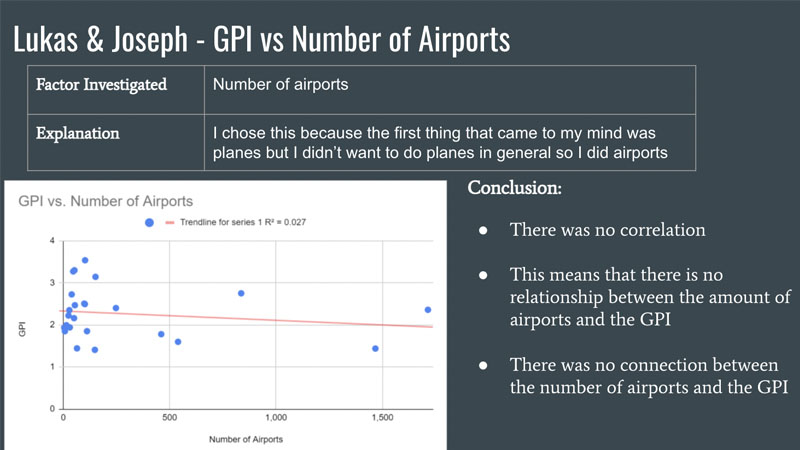
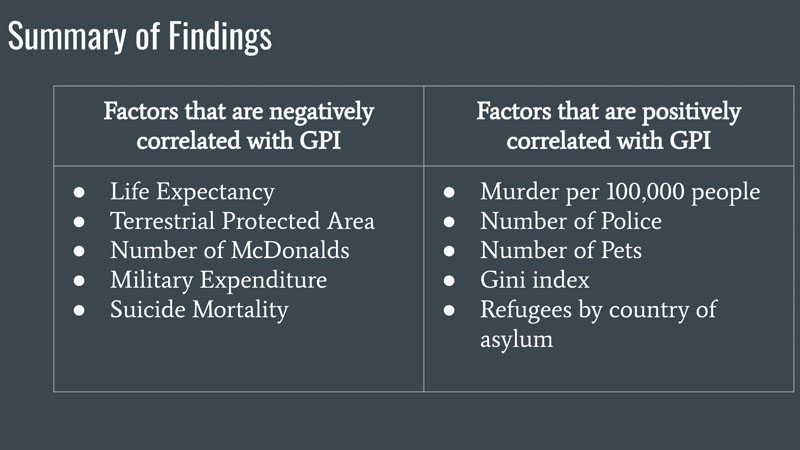
Our classes came up with some very insightful ideas about what might correlate with GPI. Is the amount of protected terrestrial area in a country correlated to its GPI score? What about a country’s carbon footprint? Or the number of McDonalds in a country? Check out our findings!
Here’s what some students had to say about the project:
“I compared my chosen factor to GPI to see if they had a correlation, put it into a scatter plot and explained and described the correlation between the two. I learned how to write math on a computer and how to write scatter plots too. Math is related to peace because we need to factor the amount of peace in a country.”
“I wrote down the data, I was moral support and a whole lot of other things. This project was really rough but at the end of the day I am taking it as a learning experience.”
“I enjoyed doing this with my partner and we did a great job asking each other and my partner helped me if I am having trouble when finding the big mac index with certain countries. I would definitely do a good job with my partner in the future.”